 Datvero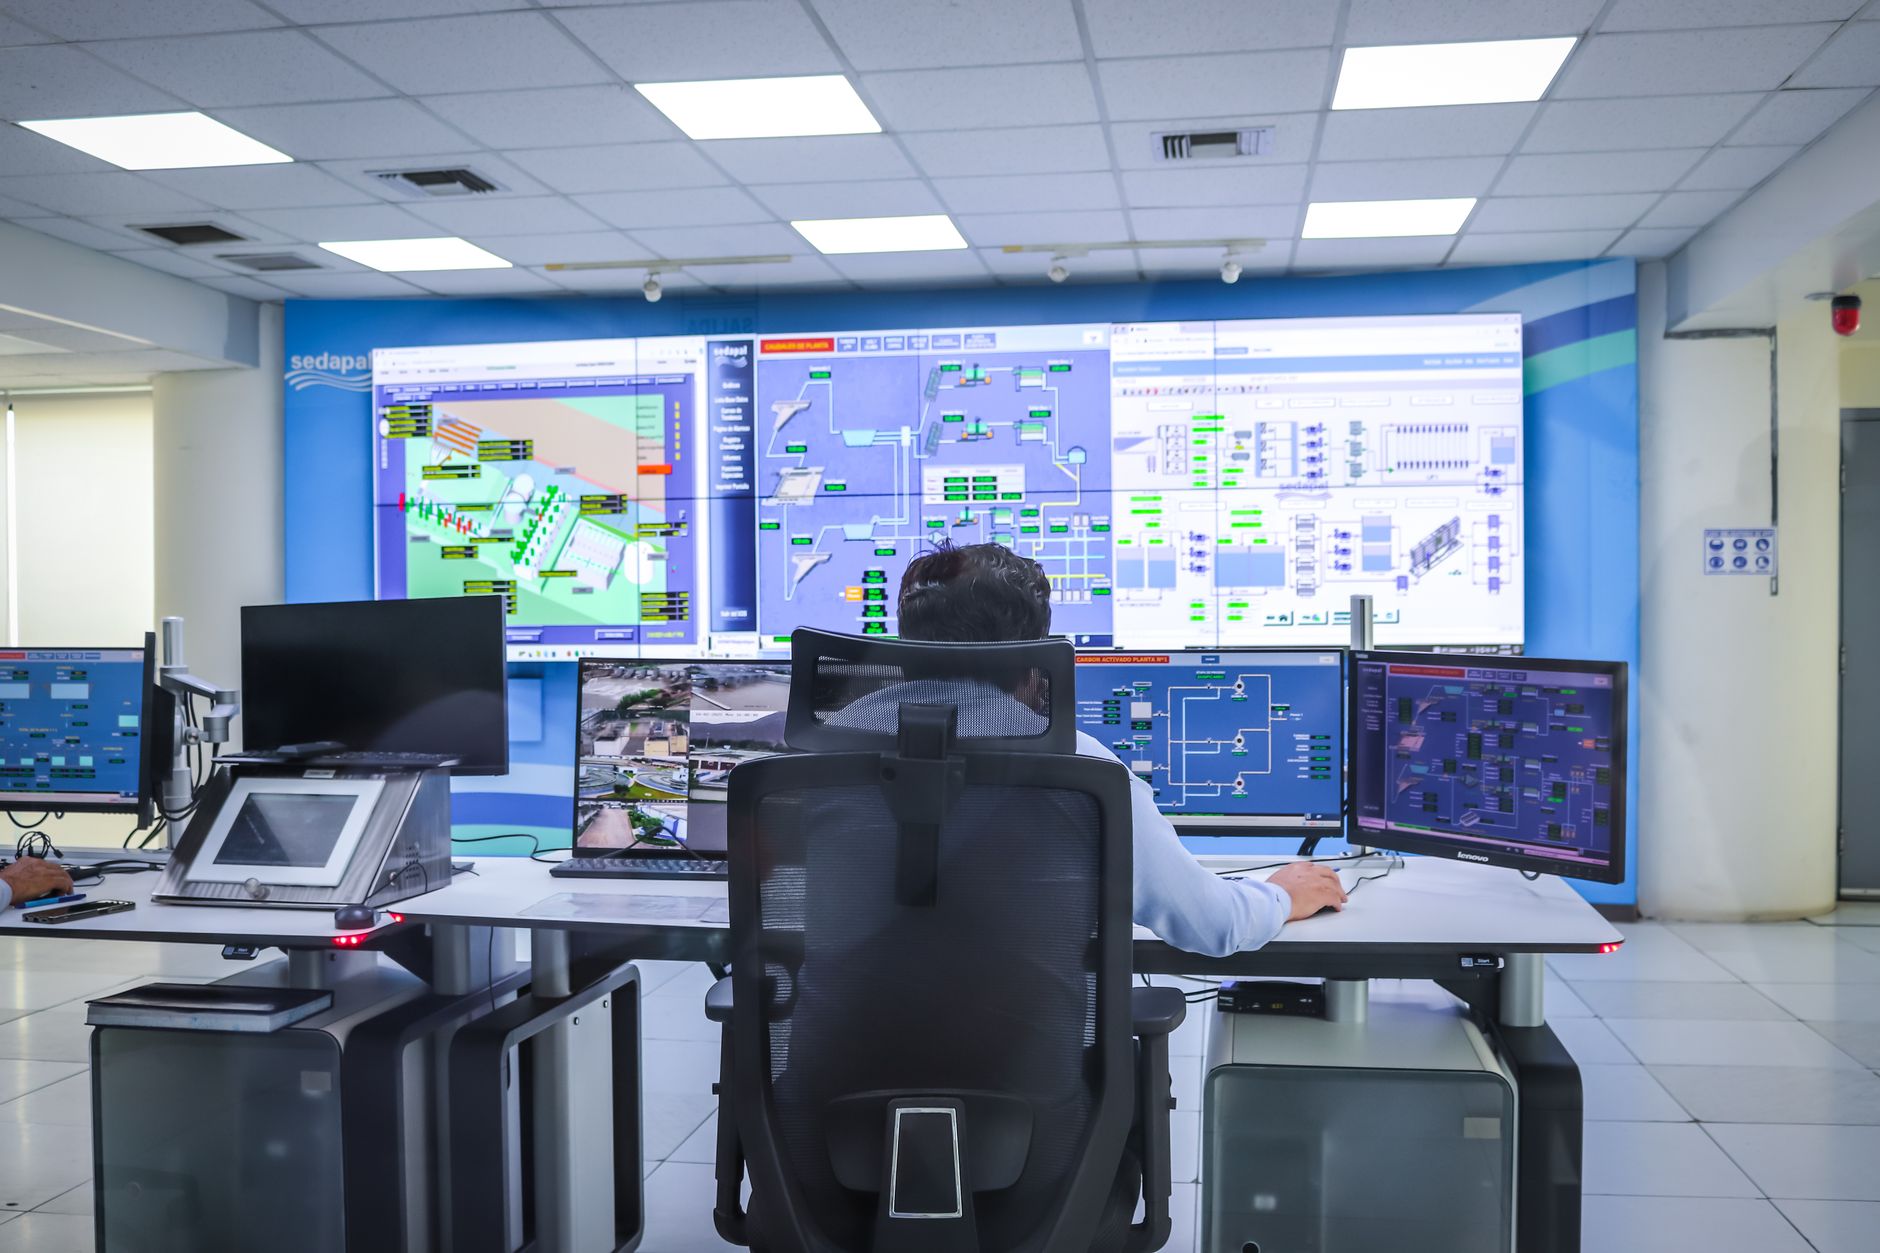
What is an automated monitoring system, in practical terms
When operations teams ask what is an automated monitoring system, they are usually not asking for a dictionary definition. They are asking why a workflow failed at 2 a.m., why nobody noticed for six hours, and why the eventual fix took longer than the outage itself. An automated monitoring system, in the context of workflow automation tools like n8n, Make and Zapier, is the layer that watches execution behaviour across those platforms and turns failures or anomalies into something a human can act on quickly.
This is a narrower definition than 'monitoring' in the general IT sense. A workflow monitoring system is not primarily about server uptime or infrastructure metrics. It is about whether the automations that move data between systems - CRM syncs, order processing, notification chains - actually completed, and if they did not, why. That distinction matters because many teams already have some visibility (execution logs inside n8n, run history inside Zapier) without having a monitoring system at all.
Datvero is built around this narrower definition: it is designed to monitor n8n, Make and Zapier workflows, with a focus on actionable alerts, diagnosis and incident tracking rather than general infrastructure observability. That framing shapes the rest of this article - the goal is to describe what a monitoring system needs to do, not to claim that any single tool, including Datvero, has been tested against alternatives.
The gap between a dashboard and real coverage
A dashboard shows state. A monitoring system responds to change in that state. This is the practical line the reader question is pointing at: which signals separate real coverage from a dashboard. A dashboard that lists recent workflow runs and their status is useful for a human who chooses to look at it, but it does nothing while nobody is looking. Real monitoring coverage implies that the system itself initiates contact when something needs attention, rather than waiting to be checked.
The second gap is context. A red status indicator tells you something failed. It does not tell you which step failed, what the input data looked like, whether the failure is isolated or part of a pattern, or whether it is likely to recur on the next scheduled run. Diagnosis - not just detection - is what separates a notification system from a monitoring system. n8n's own documentation on error handling reflects this distinction inside a single platform: workflows can be configured to trigger dedicated error workflows on failure, which is a form of built-in diagnosis-oriented routing rather than a passive log entry.
A third gap is scope. Many operations teams run automations across more than one platform - n8n for internal logic, Zapier or Make for lighter integrations. A dashboard usually reflects one platform's native view. A monitoring system, by definition, needs to aggregate signals across platforms so that an incident is visible regardless of where the underlying workflow runs. Without that aggregation, teams end up checking three separate places, which reintroduces the manual effort monitoring was supposed to remove.
Core signals a workflow monitoring system should track
Not every signal a platform exposes is equally useful for monitoring. Some are noisy, some are lagging indicators, and some only matter in combination with others. The following list reflects the categories of signal that matter for the stated principles of early detection, actionable context, controlled recovery and post-incident improvement, rather than an exhaustive technical inventory.
- Execution failures and error types, including which node or step failed and why
- Latency or duration drift compared to a workflow's normal run time, which can indicate a slow degradation before an outright failure
- Silent failures, such as a workflow that completes 'successfully' but produces no output or an unexpected empty result
- Repetition or retry patterns, since a single failure and a recurring failure require different responses
- Volume anomalies, such as a sudden drop or spike in the number of executions, which often signals an upstream trigger problem rather than a workflow bug
An example: diagnosing a stalled order-sync workflow
To make this concrete, consider a hypothetical (illustrative only) example. An operations team runs an n8n workflow that syncs new orders from an e-commerce platform into a fulfilment system every five minutes. One afternoon, fulfilment staff notice orders are missing from their queue. With only a dashboard, the team would see the workflow's status as 'active' and have to manually trigger a test run, check logs, and guess where the problem lies - losing time while orders continue to queue up unprocessed.
With a monitoring system built around the principles above, the sequence would look different. Early detection would flag that execution volume for that workflow dropped to zero starting at a specific timestamp, well before a human noticed missing orders. Actionable context would surface that the failure originated at the API authentication step, not further downstream, narrowing the investigation immediately. Controlled recovery would mean the team can decide - based on that diagnosis - whether to retry queued executions, pause the trigger, or escalate to whoever manages the API credentials, rather than blindly re-running everything. Post-incident improvement would involve reviewing why the credential expired without warning and adding a check for that specific failure mode going forward.
This example is deliberately illustrative rather than a documented case, but it shows the practical difference between a dashboard and a monitoring system: the same underlying failure, handled with very different amounts of manual effort and elapsed time depending on whether detection, diagnosis and recovery are built in or improvised.
A short decision checklist
For teams trying to evaluate whether their current setup counts as an automated monitoring system, the following questions are a practical starting point rather than a scoring formula.
- Does the system alert someone actively, or does it require someone to check a status page?
- When an alert fires, does it point to a specific step and likely cause, or only to a generic 'failed' state?
- Does it cover every platform in use (n8n, Make, Zapier), or only the one you happen to be looking at?
- Can silent failures - workflows that run without error but produce wrong or no output - be detected at all?
- After an incident is resolved, is there a record that supports reviewing why it happened and adjusting the workflow or process?
Limits every team should keep in mind
No monitoring system, however well designed, compensates for a poorly configured platform or an undefined operating process. If retry logic, credential rotation and error-workflow routing are not set up correctly within n8n, Make or Zapier themselves, a monitoring layer can only report failures faster - it cannot prevent them. Reliability depends jointly on platform configuration and team process, and a monitoring system's role is to make problems visible and diagnosable quickly, not to substitute for sound automation design.
It is also worth being explicit that any monitoring or recovery automation must respect existing access controls and data-protection requirements. Aggregating execution data across platforms, for example, should not become a reason to bypass permissions or expose sensitive payloads more broadly than necessary. This is a boundary condition for any tool operating in this space, including Datvero, and it should factor into how a team configures monitoring, not just whether it adopts one.
Frequently asked questions
Is a workflow monitoring system the same as a general IT monitoring tool?
No. General IT monitoring typically tracks infrastructure health such as server uptime or resource usage, while a workflow monitoring system focuses on whether individual automation runs completed correctly, where they failed, and why - a narrower, application-level concern specific to platforms like n8n, Make and Zapier.
Can a status dashboard alone count as monitoring?
A status dashboard shows the current or recent state of workflows but relies on someone actively checking it. Monitoring implies the system proactively surfaces problems through alerts and provides enough diagnostic context to act, rather than passively displaying data that must be interpreted manually.
What is a silent failure and why does it matter for monitoring?
A silent failure occurs when a workflow completes without an error status but still produces incorrect, incomplete or no output. It matters because standard success/failure logging will not catch it, so a monitoring system needs additional checks - such as output validation or volume tracking - to detect these cases before they cause downstream problems.
Sources and further reading
These resources provide the wider reference frame. Product statements on this page are limited to the public information provided by Datvero.